- The Stacker Report: Your Source For Silver Market Insights
- Posts
- The Silver Liquidity Trap
Silver Liquidity Trap - Physical Metal Scarcity
The silver market is no longer behaving like a standard cyclical recovery. A fundamental decoupling is underway between Western paper pricing and real-world physical supply, occurring simultaneously with rising systemic risk in global sovereign bond markets. These forces are converging into what can best be described as a silver liquidity trap — where availability of physical metal, rather than futures-market pricing, is beginning to dictate the terms of trade.
Key signals now aligning:
Silver has reclaimed the $90 level and is consolidating in a bullish continuation pattern, historically a launchpad for the next leg higher.
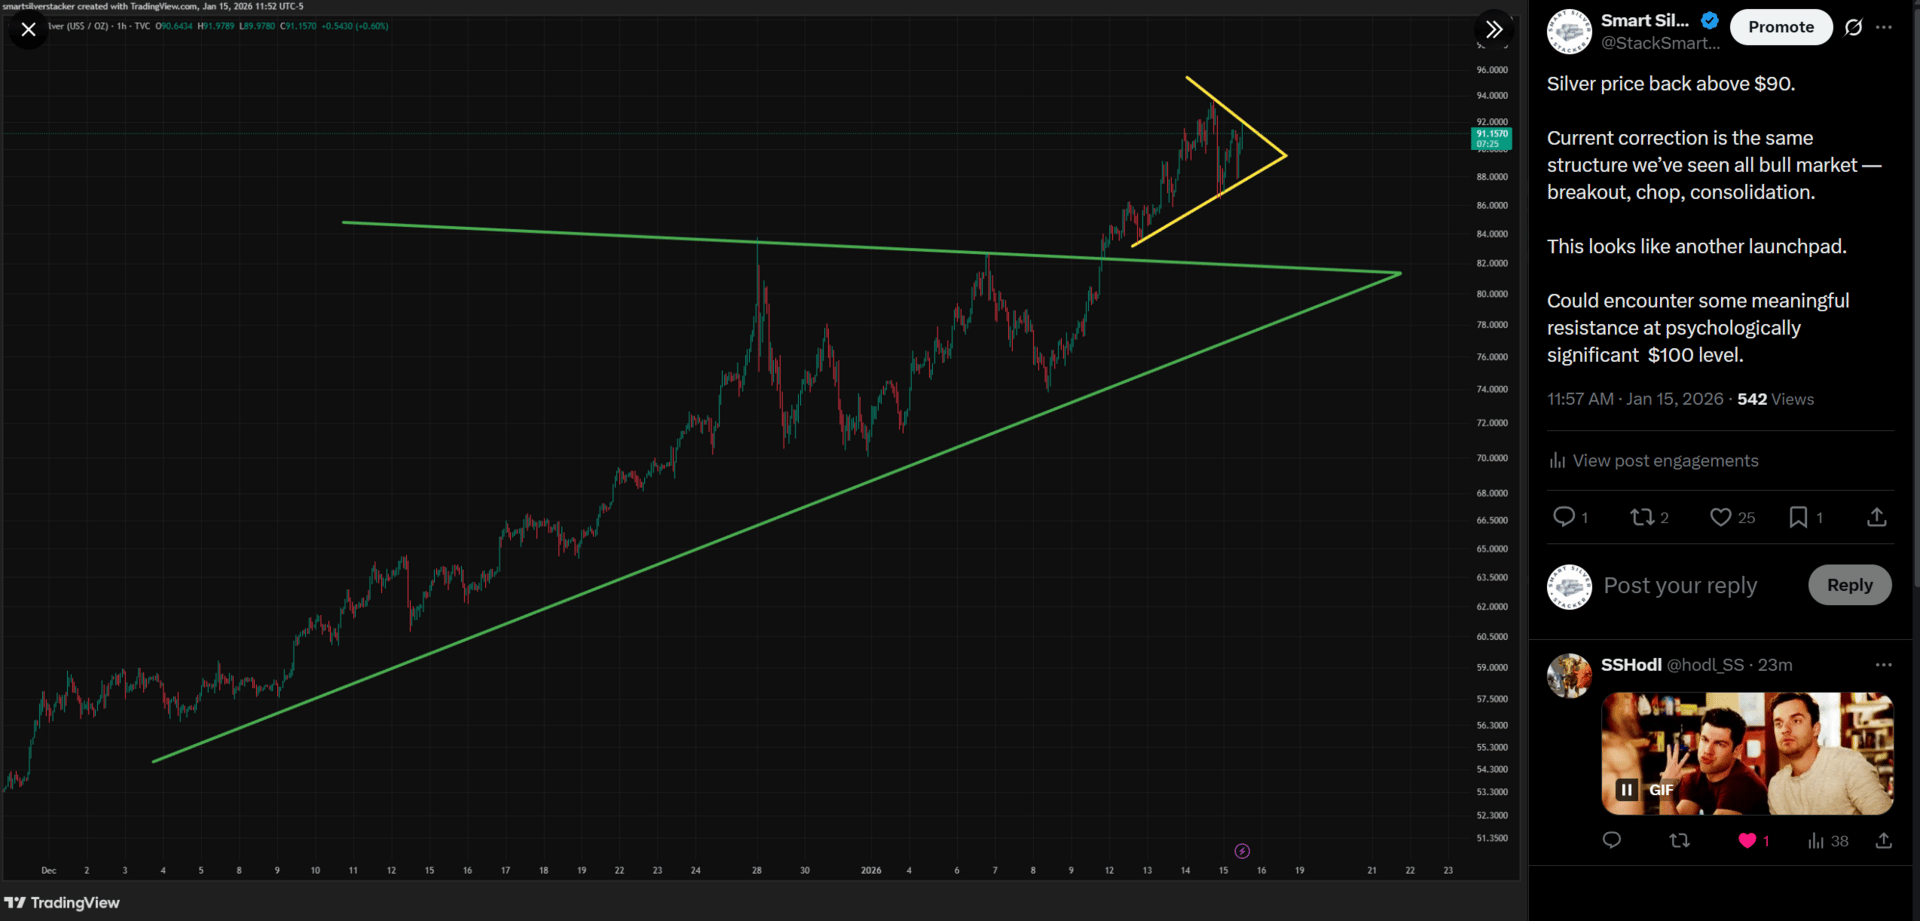
Silver Is Consolidating Before The Next Move Higher
Silver recently traded above $103/oz on the Shanghai Gold Exchange, creating a powerful arbitrage that is actively draining Western vault inventories.

Silver Surging On Shanghai Gold Exchange
Retail supply chains are under visible stress, with major dealers reporting delays and defensive policy changes.

APMEX Institutes $10,000 Buyback Minimum
CME Group has introduced smaller 100-oz cash-settled contracts, increasing paper liquidity while diverting demand away from physical delivery.

Japan’s surging bond yields threaten destabilization of U.S. Treasury markets,
setting the stage for potential Federal Reserve intervention through renewed money printing.

Japanese 30 Year Yield Has Surged To Record Highs
Junior silver miners remain priced at valuations consistent with past bear-market lows — despite silver trading near historic highs.

SILJ/Silver Ratio Near Record Lows
Taken together, these signals suggest silver is transitioning into a structurally different phase of its bull market — one driven by physical scarcity and global liquidity stress rather than speculative cycles alone.
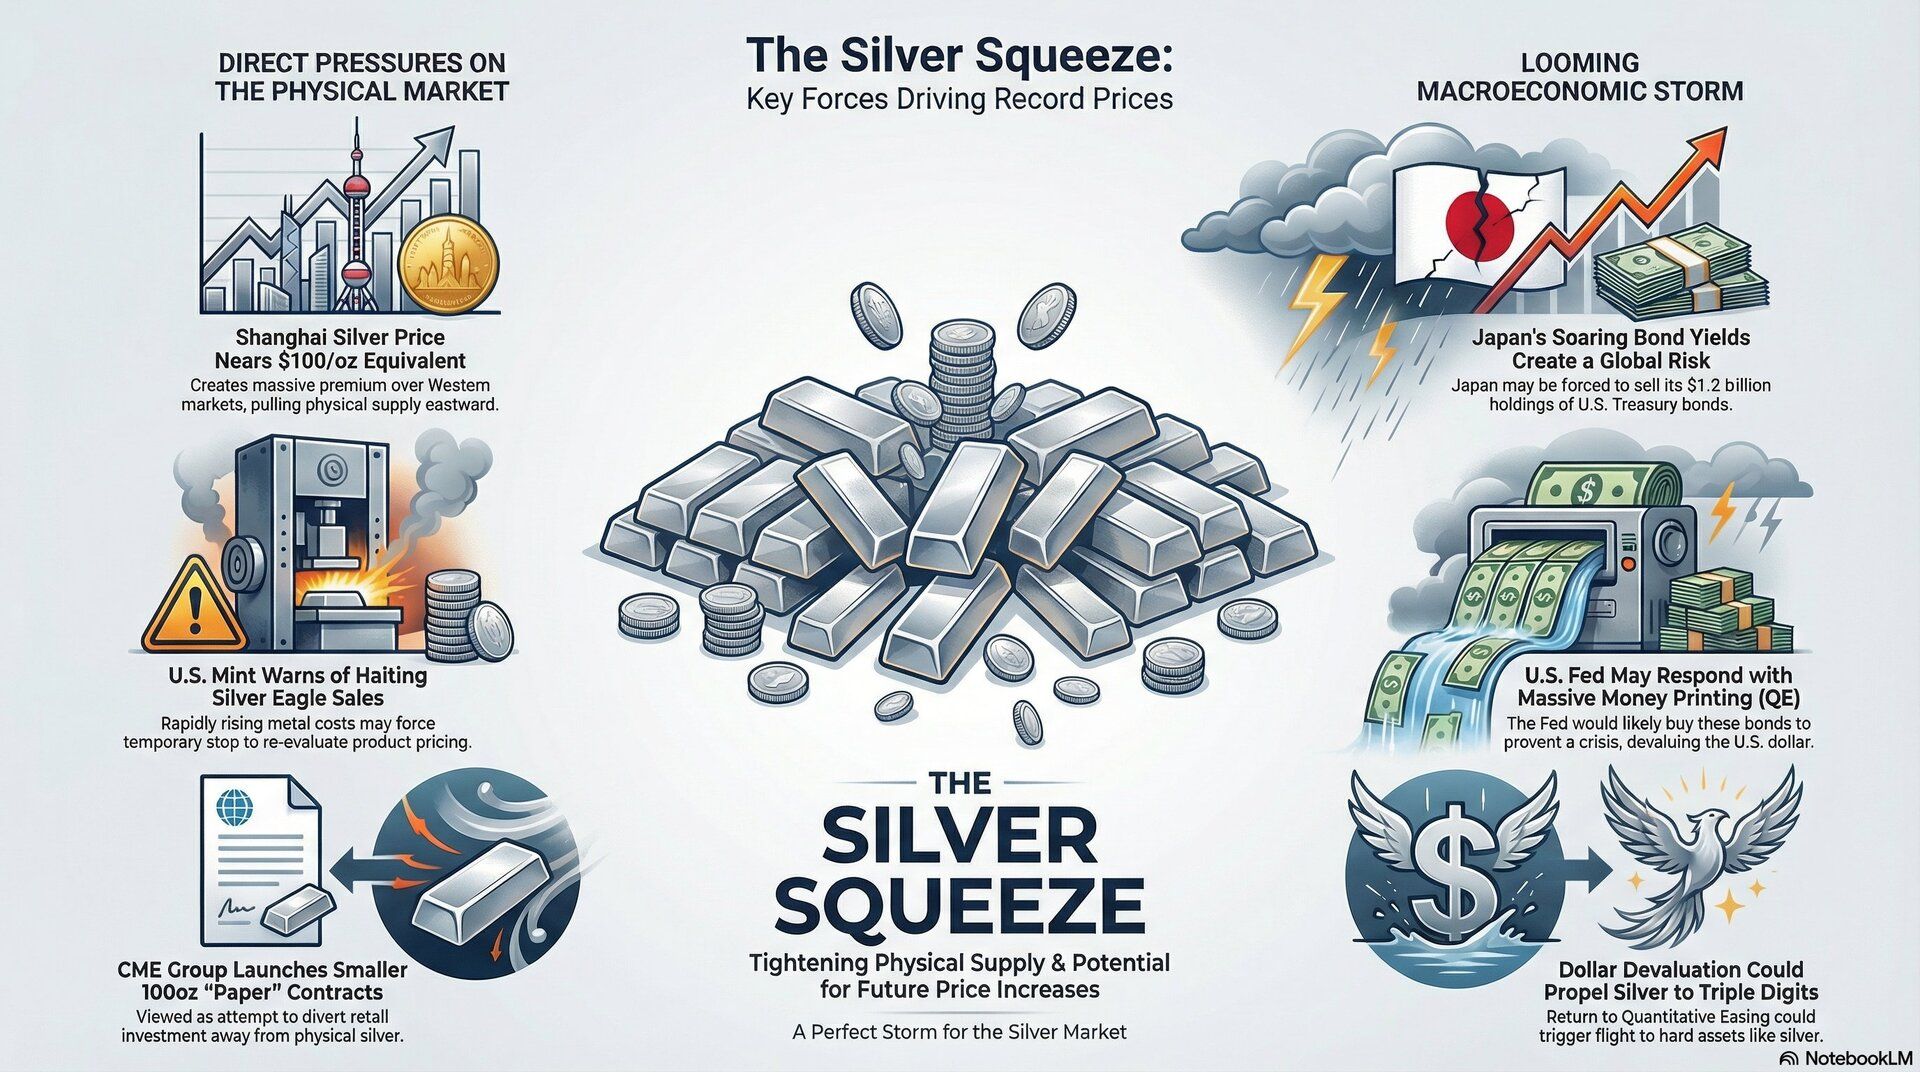
Key Factors Driving The Silver Squeeze
Market Structure: A Bull Market That Is Still Underpriced
Silver’s technical structure reflects a sustainable, stair-step bull market rather than the blow-off behavior seen at previous cycle peaks. After clearing $90, price action has entered a classic consolidation pattern that historically precedes major continuation moves.
At the same time, junior miners — often the market’s forward-looking signal — remain deeply undervalued. SILJ is trading at ratios last seen at the 2016 and 2020 bear-market bottoms, effectively pricing miners as if silver were still under $30/oz. This disconnect points to a market that has not yet repriced the metal’s new valuation regime.
The psychologically significant $100 level increasingly appears less like a ceiling and more like a future floor.
Physical Market Stress: Where the Real Signals Live
The most important signals are now emerging not from futures markets — but from physical delivery channels.
Shanghai Price Divergence
Silver trading above $103/oz on the Shanghai Gold Exchange has created a strong global arbitrage. This price gap is actively pulling physical metal eastward, steadily draining Western vault inventories.
Retail Infrastructure Friction
Major dealers are reporting processing delays and have implemented unusually high buy-back minimums. These are defensive measures that typically appear when inventory management and cash flow volatility increase — and when physical metal becomes harder to replace.
Institutional Warning Signs
The U.S. Mint has warned of potential halts in Silver Eagle sales due to pricing instability.
CME’s introduction of 100-oz cash-settled contracts expands paper liquidity while reducing pressure on physical delivery systems.
These signals point to tightening physical availability beneath an increasingly synthetic pricing structure — the classic precursor to a violent price reconciliation.
The Macro Backdrop: Bonds, QE, and Dollar Risk
Silver’s move is increasingly tied to sovereign bond market stress.
Japan’s rising yields threaten forced liquidation of U.S. Treasuries. If that occurs, the Federal Reserve would likely be forced to step in with renewed quantitative easing to prevent bond-market instability — sacrificing dollar purchasing power in the process.
This macro chain positions silver as a primary beneficiary of currency devaluation, shifting it from a speculative asset into a monetary hedge.
Forward-Looking Risk Map
Bullish Scenario:
Fed intervention triggers renewed QE, driving dollar devaluation. Western spot prices close the gap with Shanghai pricing, pushing silver decisively into triple digits.
Neutral Scenario:
Silver consolidates around $100 while physical premiums remain elevated. Structural tightness persists until macro catalysts accelerate.
Volatility Scenario:
Paper markets suppress spot pricing short-term, but physical shortages and delivery bottlenecks keep real-world silver highly resilient.
Closing Thoughts
The convergence of global bond-market instability, physical supply drain, and stressed delivery infrastructure marks the beginning of a new valuation regime for silver.
In this environment, silver’s strategic value is no longer defined by futures quotes — but by its role as a finite, physical anchor in a system increasingly reliant on monetary expansion.
The signal is clear:
Scarcity is becoming the price driver.
Stay Safe And Happy Stacking
-Smart Silver Stacker
Disclaimer:
This publication reflects personal opinions and market commentary and is provided for informational and educational purposes only. It does not constitute financial, investment, or trading advice. All investing involves risk, and readers should conduct their own independent research and consult a qualified financial professional before making any financial decisions.